Retaining people’s attention with captivating information and visuals is essential in business development.
In today’s fast-paced digital landscape, shareable infographics have become one of the most effective tools for marketers to engage audiences and boost brand visibility.
These visually appealing graphics often simplify complex data, enhance content consumption, and encourage social sharing, making them a powerful asset in any marketing strategy.
When designed strategically, infographics can increase website traffic, improve audience retention, and elevate brand authority.
This guide will explore seven essential tips for creating highly shareable infographics that captivate your audience and amplify your marketing efforts.
Table of Contents
Key Takeaways
- Infographics boost engagement by making complex information visually appealing and easy to digest.
- A clear objective ensures your infographic aligns with your marketing goals and target audience.
- Simplicity is key—avoid clutter and focus on one main idea for maximum impact.
- Strong visuals enhance readability, using the right colors, fonts, and graphics for a polished look.
- Storytelling and data build credibility, making your infographic more engaging and informative.
- A compelling CTA drives action, guiding viewers to share, visit, or engage with your brand.
- Optimising for easy sharing increases reach, making it mobile-friendly and quick to load.
- Testing and tracking performance help refine your infographics for better results over time.
- Create high-impact, shareable infographics to elevate your brand and maximise engagement!
Why Are Infographics Considered Highly Shareable on Social Media?
In a world overflowing with content marketing online, standing out can be a challenge. Infographics offer a visually compelling way to present information, making it easier for audiences to grasp key insights quickly.
1. Increased Engagement
According to a study by MIT neuroscientists, they found that the human brain can identify images seen for as little as 13 milliseconds, making infographics an ideal way to capture attention quickly.
Unlike long-form articles that may lose reader interest, a well-designed infographic delivers key insights at a glance.
Example:
A social media agency using an infographic to illustrate “The Best Times to Post on Social Media” can instantly engage marketers looking for quick insights.
2. Simplifies Complex Information

Generated with AI
Infographics help break down intricate data into visually digestible formats, making it easier for audiences to retain and understand information.
Whether it’s presenting industry trends, statistics, or step-by-step guides, infographics make learning more interactive and engaging.
Example:
A fintech company could create an infographic on “How Blockchain Technology Works” with simplified diagrams instead of lengthy explanations.
3. Boosts Social Media Shares
Content that is visually appealing is more likely to be shared, which simultaneously increases its reach and potential virality.
Infographics are particularly effective for platforms like Pinterest, LinkedIn, Instagram, and Twitter (X), where visual content performs best.
Example:
A travel agency sharing an infographic titled “Top 10 Must-Visit Destinations in 2025” on Instagram could attract thousands of shares and engagement.
4. Drives Website Traffic and SEO
Infographics enhance social engagement and improve SEO. When embedded in blog posts, they can increase dwell time and encourage backlinks from other websites.
High-quality infographics can attract organic traffic and improve search engine rankings.
Example:
A digital marketing blog publishing an infographic titled “SEO vs. PPC: Which One Is Right for Your Business?” can drive traffic from businesses researching their advertising options.
Now, let’s dive into the meaningful tips for crafting highly shareable infographics.
7 Tips for Creating Shareable Infographics
1. Start with a Clear Objective
Before designing an infographic, it’s crucial to establish a clear objective that aligns with your marketing goals.
A well-defined purpose ensures that your infographic contains eye-catching visuals, which are effective in conveying the intended message to your audience.
Define Your Goal

Ask yourself these questions:
- What is the main purpose of this infographic? Is it to educate, inform, persuade, or entertain?
- Who is the target audience? Is it for customers, industry professionals, or general consumers?
- What action do you want viewers to take after seeing it? Do you want them to share, visit your website, or make a purchase?
For example, an educational infographic might break down a complex topic into easy-to-digest visuals, while a promotional infographic could showcase a product’s benefits in an attractive way.
Align With Your Brand Message
Your infographic should reflect your brand’s tone, style, and message. Whether you’re a tech company explaining AI trends or a fitness brand promoting workout routines, maintaining brand consistency helps reinforce credibility and recognition.
Example:
A food delivery service creating an infographic titled “How to Eat Healthy on a Budget” can educate customers while subtly promoting its affordable meal options.
By defining your objective early on, you get to ensure that your infographic remains focused, relevant, and shareable, ultimately driving engagement and achieving your marketing goals.
2. Keep It Simple and Focused
One of the biggest mistakes in infographic design is overloading it with too much information. A cluttered infographic can confuse your audience, making it less engaging and harder to share. Instead, focus on delivering a single, clear message in a visually digestible format.
Simplicity matters as it enhances readability, where viewers should be able to understand the key message at a glance. It also prevents information overload which can overwhelm the audience and lead them to disengagement.
How to Keep Your Infographic Simple & Focused?
- Stick to One Core Idea
Each shared infographic should communicate one primary topic rather than trying
to cover too much at once. If your infographic feels overloaded, consider breaking it
into a series of infographics instead.
For example, instead of creating a single infographic on “Everything You Need to
Know About Digital Marketing”, break it down into separate infographics for SEO,
social media marketing, and paid advertising.
- Use Concise Text
An infographic is not a blog post, so you should keep the text short, punchy, and easy to scan.
You can use bullet points instead of long paragraphs, bolded key terms to highlight important key takeaways, and numbers and icons to replace excessive keywords.
As an instance, a supplement brand designing an infographic on “5 Essential Vitamins for Boosting Immunity” should list each vitamin with a short description rather than lengthy explanations.
- Organise Information Visually
Use a clear layout with logical flow so readers can follow along effortlessly.
Try arranging content in sections with headers for easy navigation, infographic-friendly formats such as comparisons and step-by-step processes, and leave plenty of white space to avoid a crowded look.
For example, a skincare brand creating an infographic on “The Best Morning Skincare Routine” could structure it step by step with numbered icons, making it easy to follow.
- Limit Colours and Fonts
Using too many colour schemes, fonts, or design elements on your infographic can make it look messy.
Stick to a cohesive colour palette that aligns with your brand, a maximum of two fonts for consistency and readability, and high quality icons and visuals instead of excessive text.
For instance, a travel agency promoting “Top 10 Must-Visit Destinations in 2025” should use colour-coded sections rather than overwhelming the infographic with multiple fonts and colours.
A simple, well-structured infographic is more effective than one crammed with excessive details. By keeping it focused, visually clean, and easy to understand, you increase the chances of your infographic being shared, helping you reach a wider audience with maximum impact.
3. Use a Visually Appealing Design
A well-designed infographic grabs attention, improves readability, and boosts shareability. The right mix of colours, typography, layout, and visuals ensures clarity and engagement.
Choose a Cohesive Color Palette
- Stick to 3-5 complementary colors that match your brand.
- Use contrast to highlight key points without overwhelming the viewer.
Example: A fitness infographic uses bold, energetic colors to convey excitement.
Use High-Quality Graphics and Icons
- Replace excessive text with icons and illustrations for better visual flow.
- Use vector-based graphics to maintain clarity.
Example: A travel infographic includes palm trees and airplanes to enhance engagement.
Select Readable and Consistent Typography
- Limit to 2-3 fonts for clarity and professionalism.
- Use bold headings to emphasise key takeaways.
Example: A corporate infographic on remote work uses clean, sans-serif fonts for easy reading.
Structure for Easy Flow
- Use sections, headers, and dividers for clear organisation.
- Follow a Z or F reading pattern for natural eye movement.
Example: A timeline infographic arranges events chronologically for seamless navigation.
Optimise for Different Screens
- Use a vertical layout for social media and mobile-friendly viewing.
- Keep text concise to ensure readability on smaller screens.
Example: A marketing infographic on Instagram engagement is designed as a tall, scrollable format.
A visually appealing infographic enhances engagement, strengthens branding, and maximises impact. With the right design choices, your infographic will be clear, professional, and highly shareable!
Want to master the art of social media content? Discover the different types of content that drive engagement and grow your brand’s visual communication!
4. Optimise for Easy Sharing
A great infographic is only effective if people can easily share it across multiple platforms. To expand reach, your infographic must be accessible, mobile-friendly, and shareable with just a few clicks.
Ensure Mobile-Friendliness
Most users consume content on smartphones, so your infographic should be designed for smaller screens too. Use a vertical layout, keep text legible, and test it on mobile devices to ensure readability.
Provide Social Sharing Options
Make sharing effortless by including one-click share buttons for Facebook, LinkedIn, Twitter (X), and Pinterest. Adding an embed code on your website will also allow bloggers and other businesses to feature it easily.
Optimise File Size for Faster Loading
Large image files slow down loading times which ultimately reduces user experience, and surely we want to avoid that. Compress images using tools like TinyPNG and save them in PNG or JPEG formats to maintain quality while keeping the file under 1MB.
Distribute Across Multiple Platforms
Generated with AI
Extend reach by sharing the infographic on social media, email newsletters, blogs, and infographic directories like Visual.ly. A well-distributed infographic has a higher chance of going viral and driving more engagement.
For example, a fintech company designing an infographic on “Online Banking Security Tips” could include one-click social sharing buttons for LinkedIn and Twitter.
5. Incorporate Data and Storytelling
A great infographic isn’t just visually appealing—it should also tell a compelling story backed by credible data. Combining statistics with engaging storytelling makes the content more informative, trustworthy, and memorable.
Incorporating data is important because people trust content that is supported by real facts and numbers. Using verified data adds credibility and helps explain complex topics in a clear and visual way.
Charts, graphs, and percentages make information easier to digest and boost engagement.
| Type of Infographic | Visual Example* |
| Timeline infographics – Visually presents information in a chronological order, making it easy to follow how things have evolved or progressed. – This format is commonly used for historical overviews, business achievements, or process breakdowns. |  A tech company creating an infographic on “The Evolution of AI from 1950 to 2024” could use a horizontal timeline with key advancements marked by years, along with small AI-related icons and descriptions. |
| Comparison infographics – Helps readers quickly understand the pros and cons or key distinctions between different options. – It’s particularly effective for marketing, product differentiation, and industry comparisons. |  A digital marketing agency creating an infographic on “SEO vs. PPC – Which One Is Better for Your Business?” could use two columns with pros and cons, incorporating relevant icons like a search bar for SEO and a dollar sign for PPC. |
| Process Infographics – Simplifies workflows, instructions, or methodologies. – It’s great for how-to guides, explaining a system, or outlining a step-by-step approach. |  A fitness brand designing an infographic titled “How to Start a Morning Workout Routine” could use a five-step structure with exercise icons and short descriptions like “Step 1: Stretch | Step 2: Warm-up | Step 3: Cardio.” |
| Data visualisation infographics – Transforms raw numbers into compelling visuals, making it easier to interpret insights and trends. |  A cybersecurity firm creating an infographic on “The Rise of Cybercrime in 2024” could use bar charts to show increasing cyberattack incidents over the years, along with icons representing different types of cyber threats. |
| List-based infographics – Organises information into a structured, scannable format. – Perfect for curated content, such as tips, best practices, or ranking lists. |  A marketing consultant creating an infographic on “10 Social Media Marketing Hacks to Boost Engagement” could use a numbered list with social media icons and concise text for each tip. |
*The above images (generated by Gemini) are for visual purposes.
Data alone can be dull, and stories alone may lack credibility. By blending accurate statistics with engaging storytelling, your infographic becomes more powerful, informative, and shareable, increasing its impact across audiences.
6. Include a Strong Call to Action (CTA)
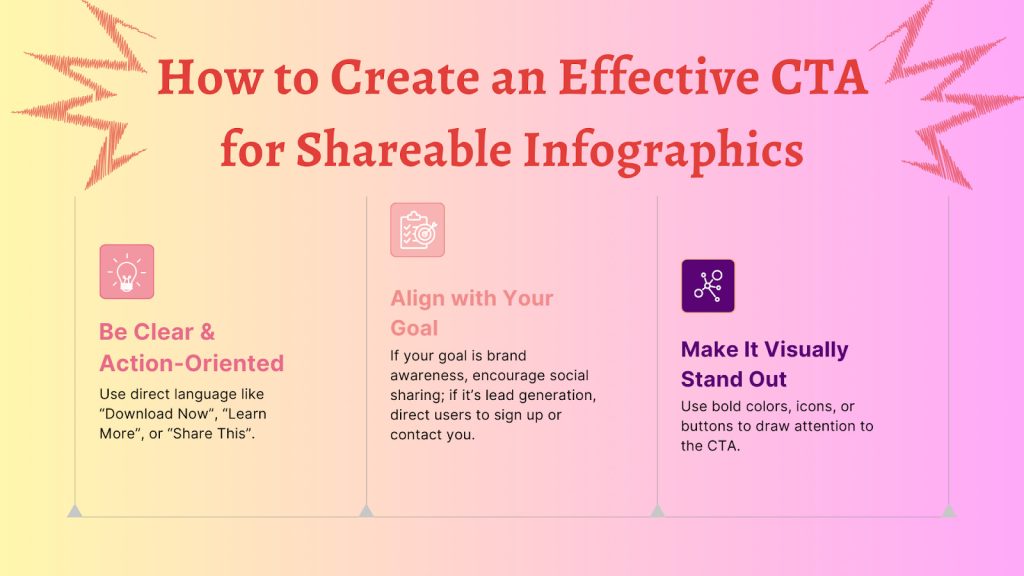
A great infographic should inspire action, not just provide information. A clear and compelling CTA often tells viewers what to do next—whether it’s visiting a website, sharing the infographic, or engaging with your brand.
A strong CTA helps convert viewers into leads, customers, or brand advocates. Without one, even the most well-designed infographic may fail to drive meaningful engagement.
A clear and well-placed CTA can increase the impact of your infographic, guiding viewers to take action and further engage with your brand.
7. Test and Analyse Performance
Creating a great infographic is just the first step—analysing its performance ensures it’s truly effective. Tracking key metrics helps you understand what works, what doesn’t, and how to improve future designs.
3 Ways to Review Performance
- Monitor key metrics such as shares & engagements, website traffic, and Click-Through Rates (CTR)
- Use A/B testing to test different designs, CTAs, and placements to see what performs best
- Gather feedback from audience and refine your approach based on what works
Conclusion
Shareable infographics are a powerful tool to engage audiences, simplify information, and boost brand visibility. By following these seven tips, you can create infographics that are visually compelling, informative, and widely shared.
From setting a clear objective to using strong visuals, storytelling, and data, each step enhances effectiveness for your marketing strategy. A strong CTA drives action, while optimisation and testing ensure maximum reach and impact.
When executed strategically, infographics can increase traffic, strengthen credibility, and improve engagement. Start creating high-quality, shareable infographics to elevate your brand and expand your reach.
To boost your brand’s visibility and engagement, partner up with Newnormz social media marketing services today!
From strategy to execution, we help you create impactful content that drives real results. Let’s take your social media to the next level—Contact us now!